Our Projects
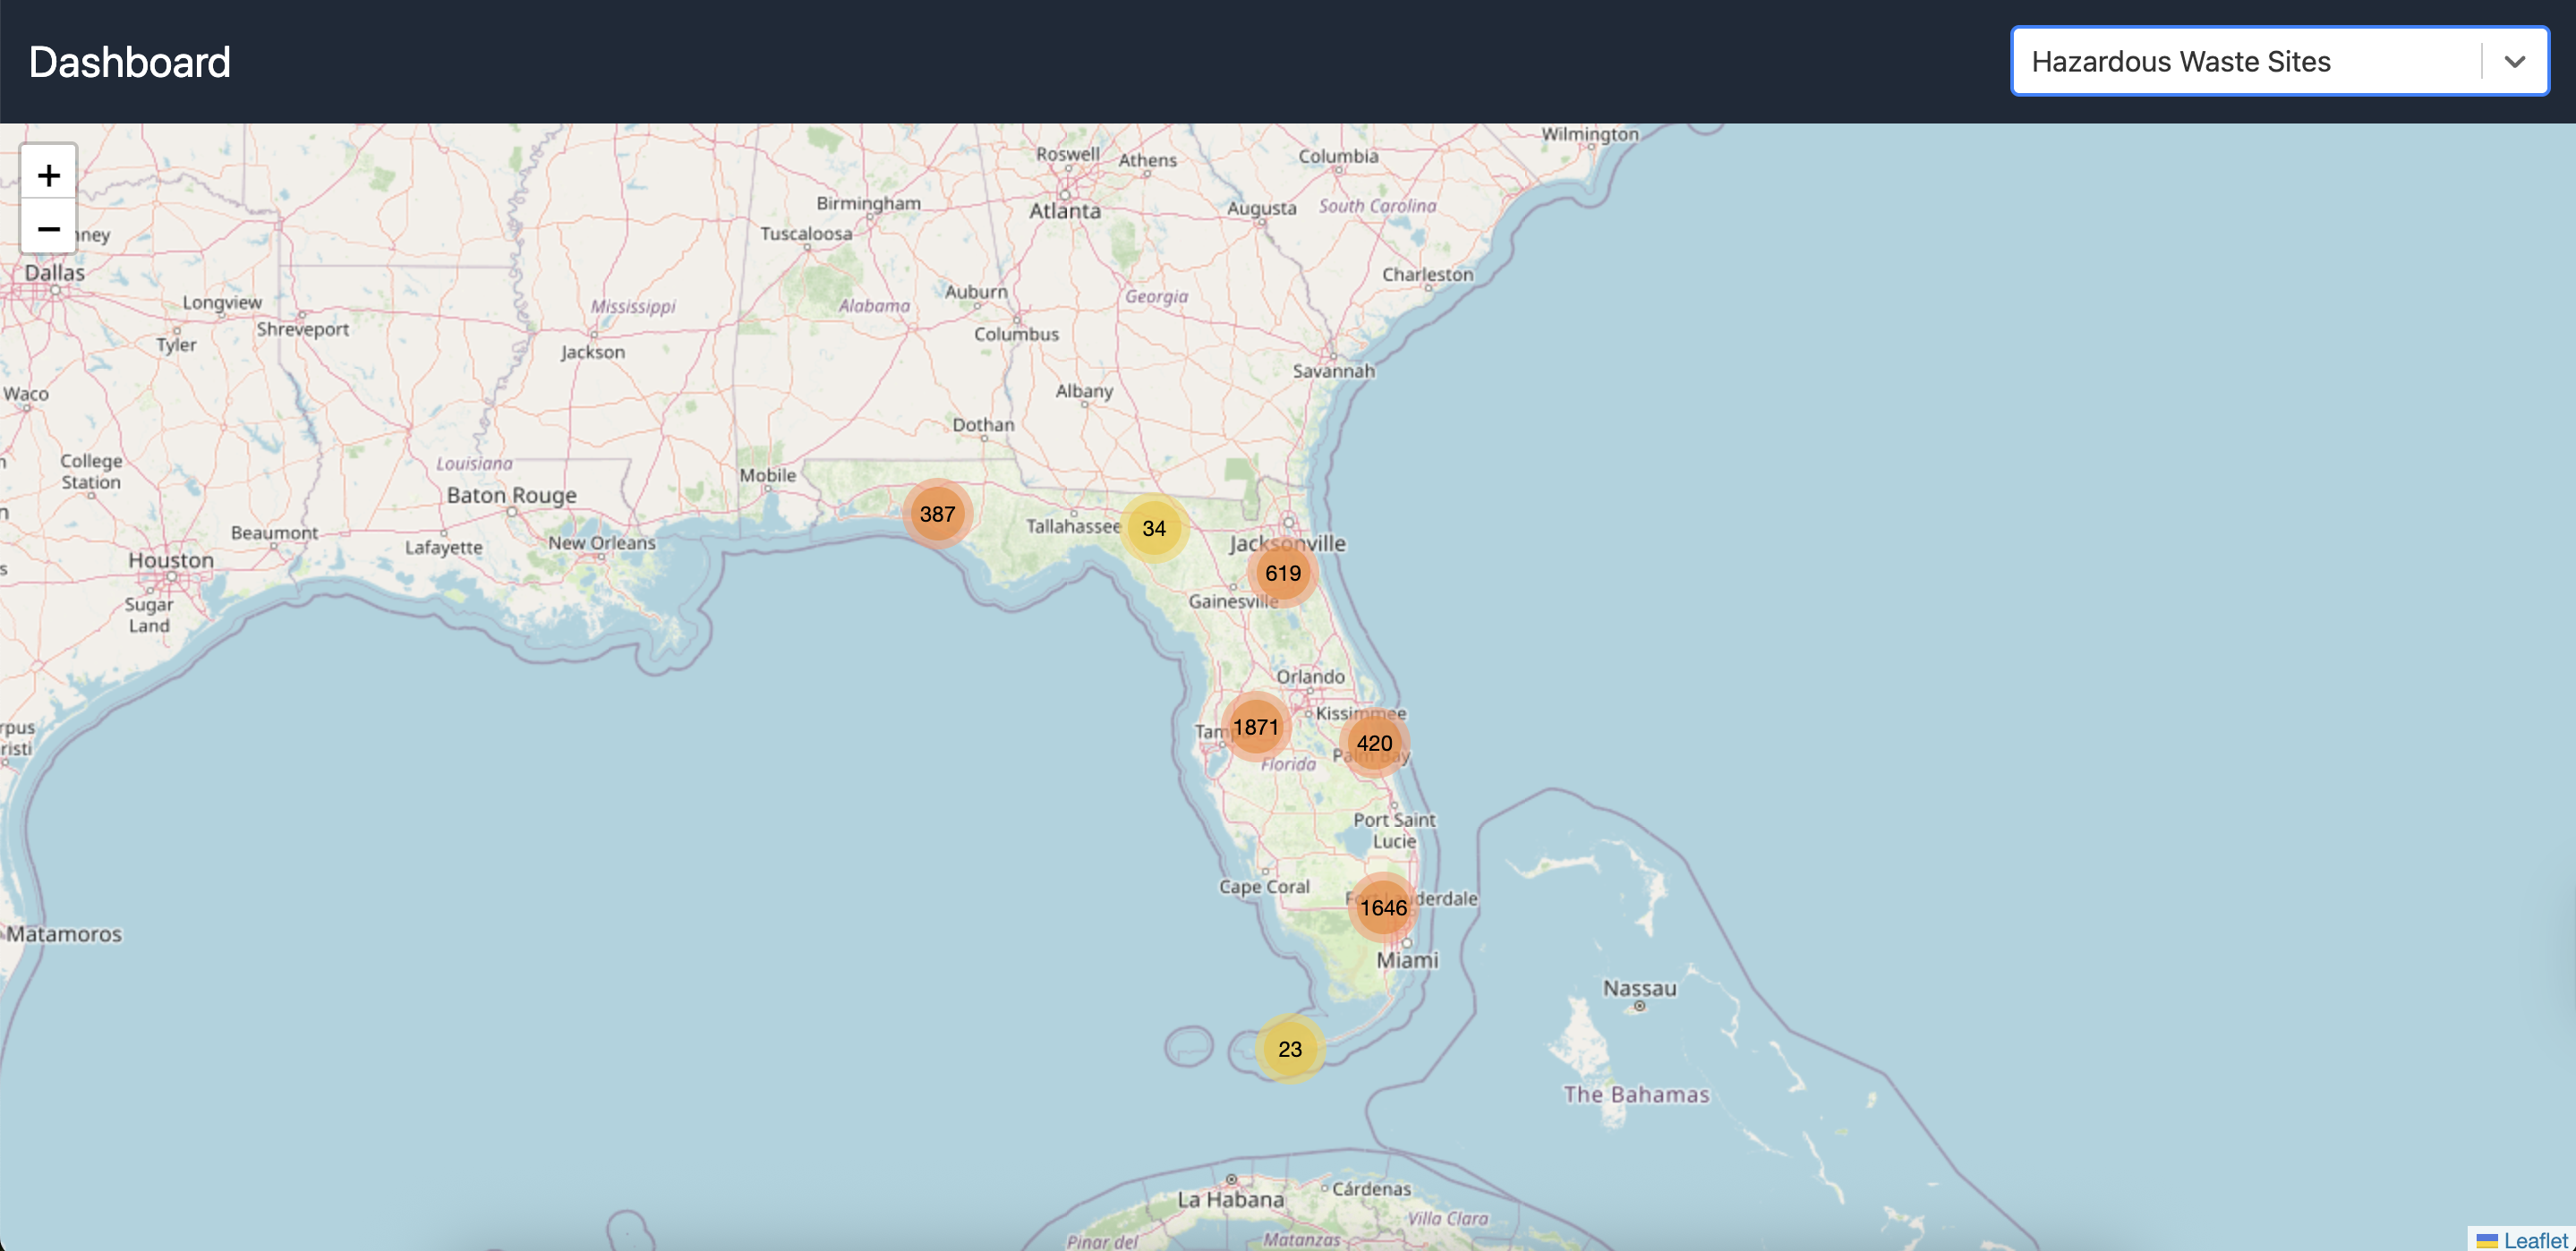
Environmental Justice Dashboard
Building an environmental justice dashboard that will analyze the demographic and environmental variables within a given buffer range around inputted or preloaded data points.
React.jsLeafletWeb DevelopmentFirebase3D Visualization
In Development
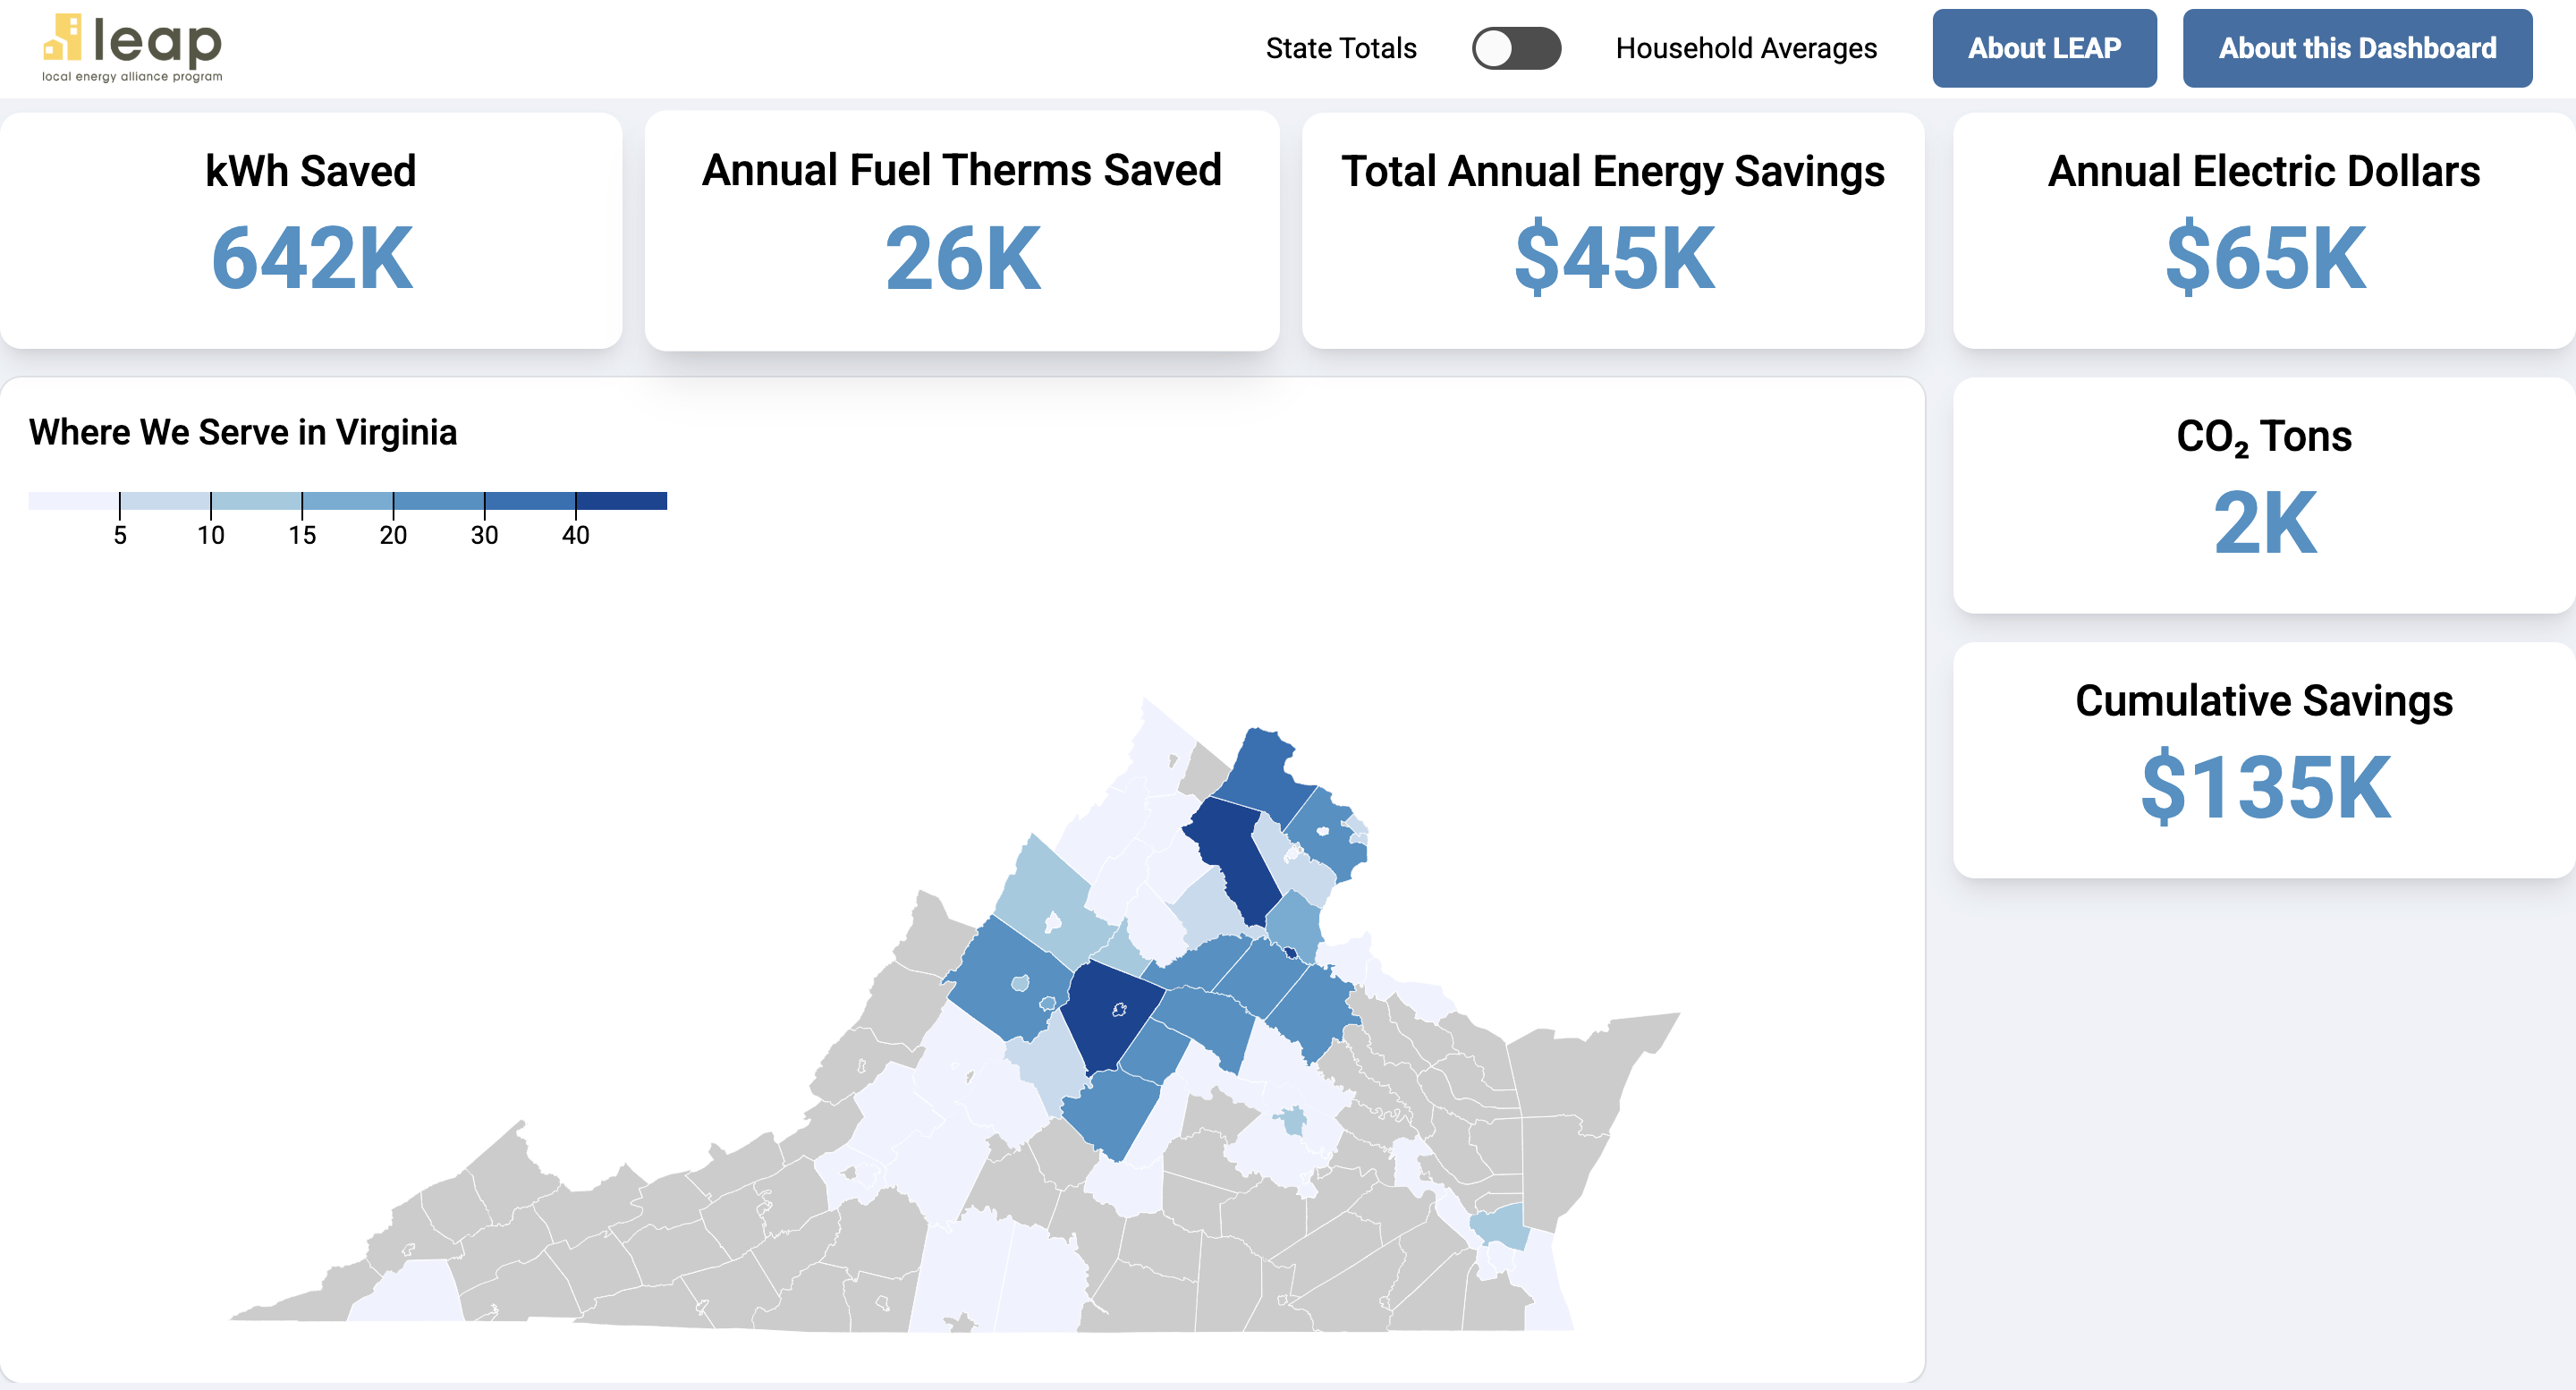
LEAP Energy Efficiency Dashboard
Creating a dynamic dashboard for the Local Energy Alliance Program (LEAP) to visualize energy saving metrics and service areas.
JavaScriptD3.jsMonday.com APIData VisualizationWeb Development
In Development
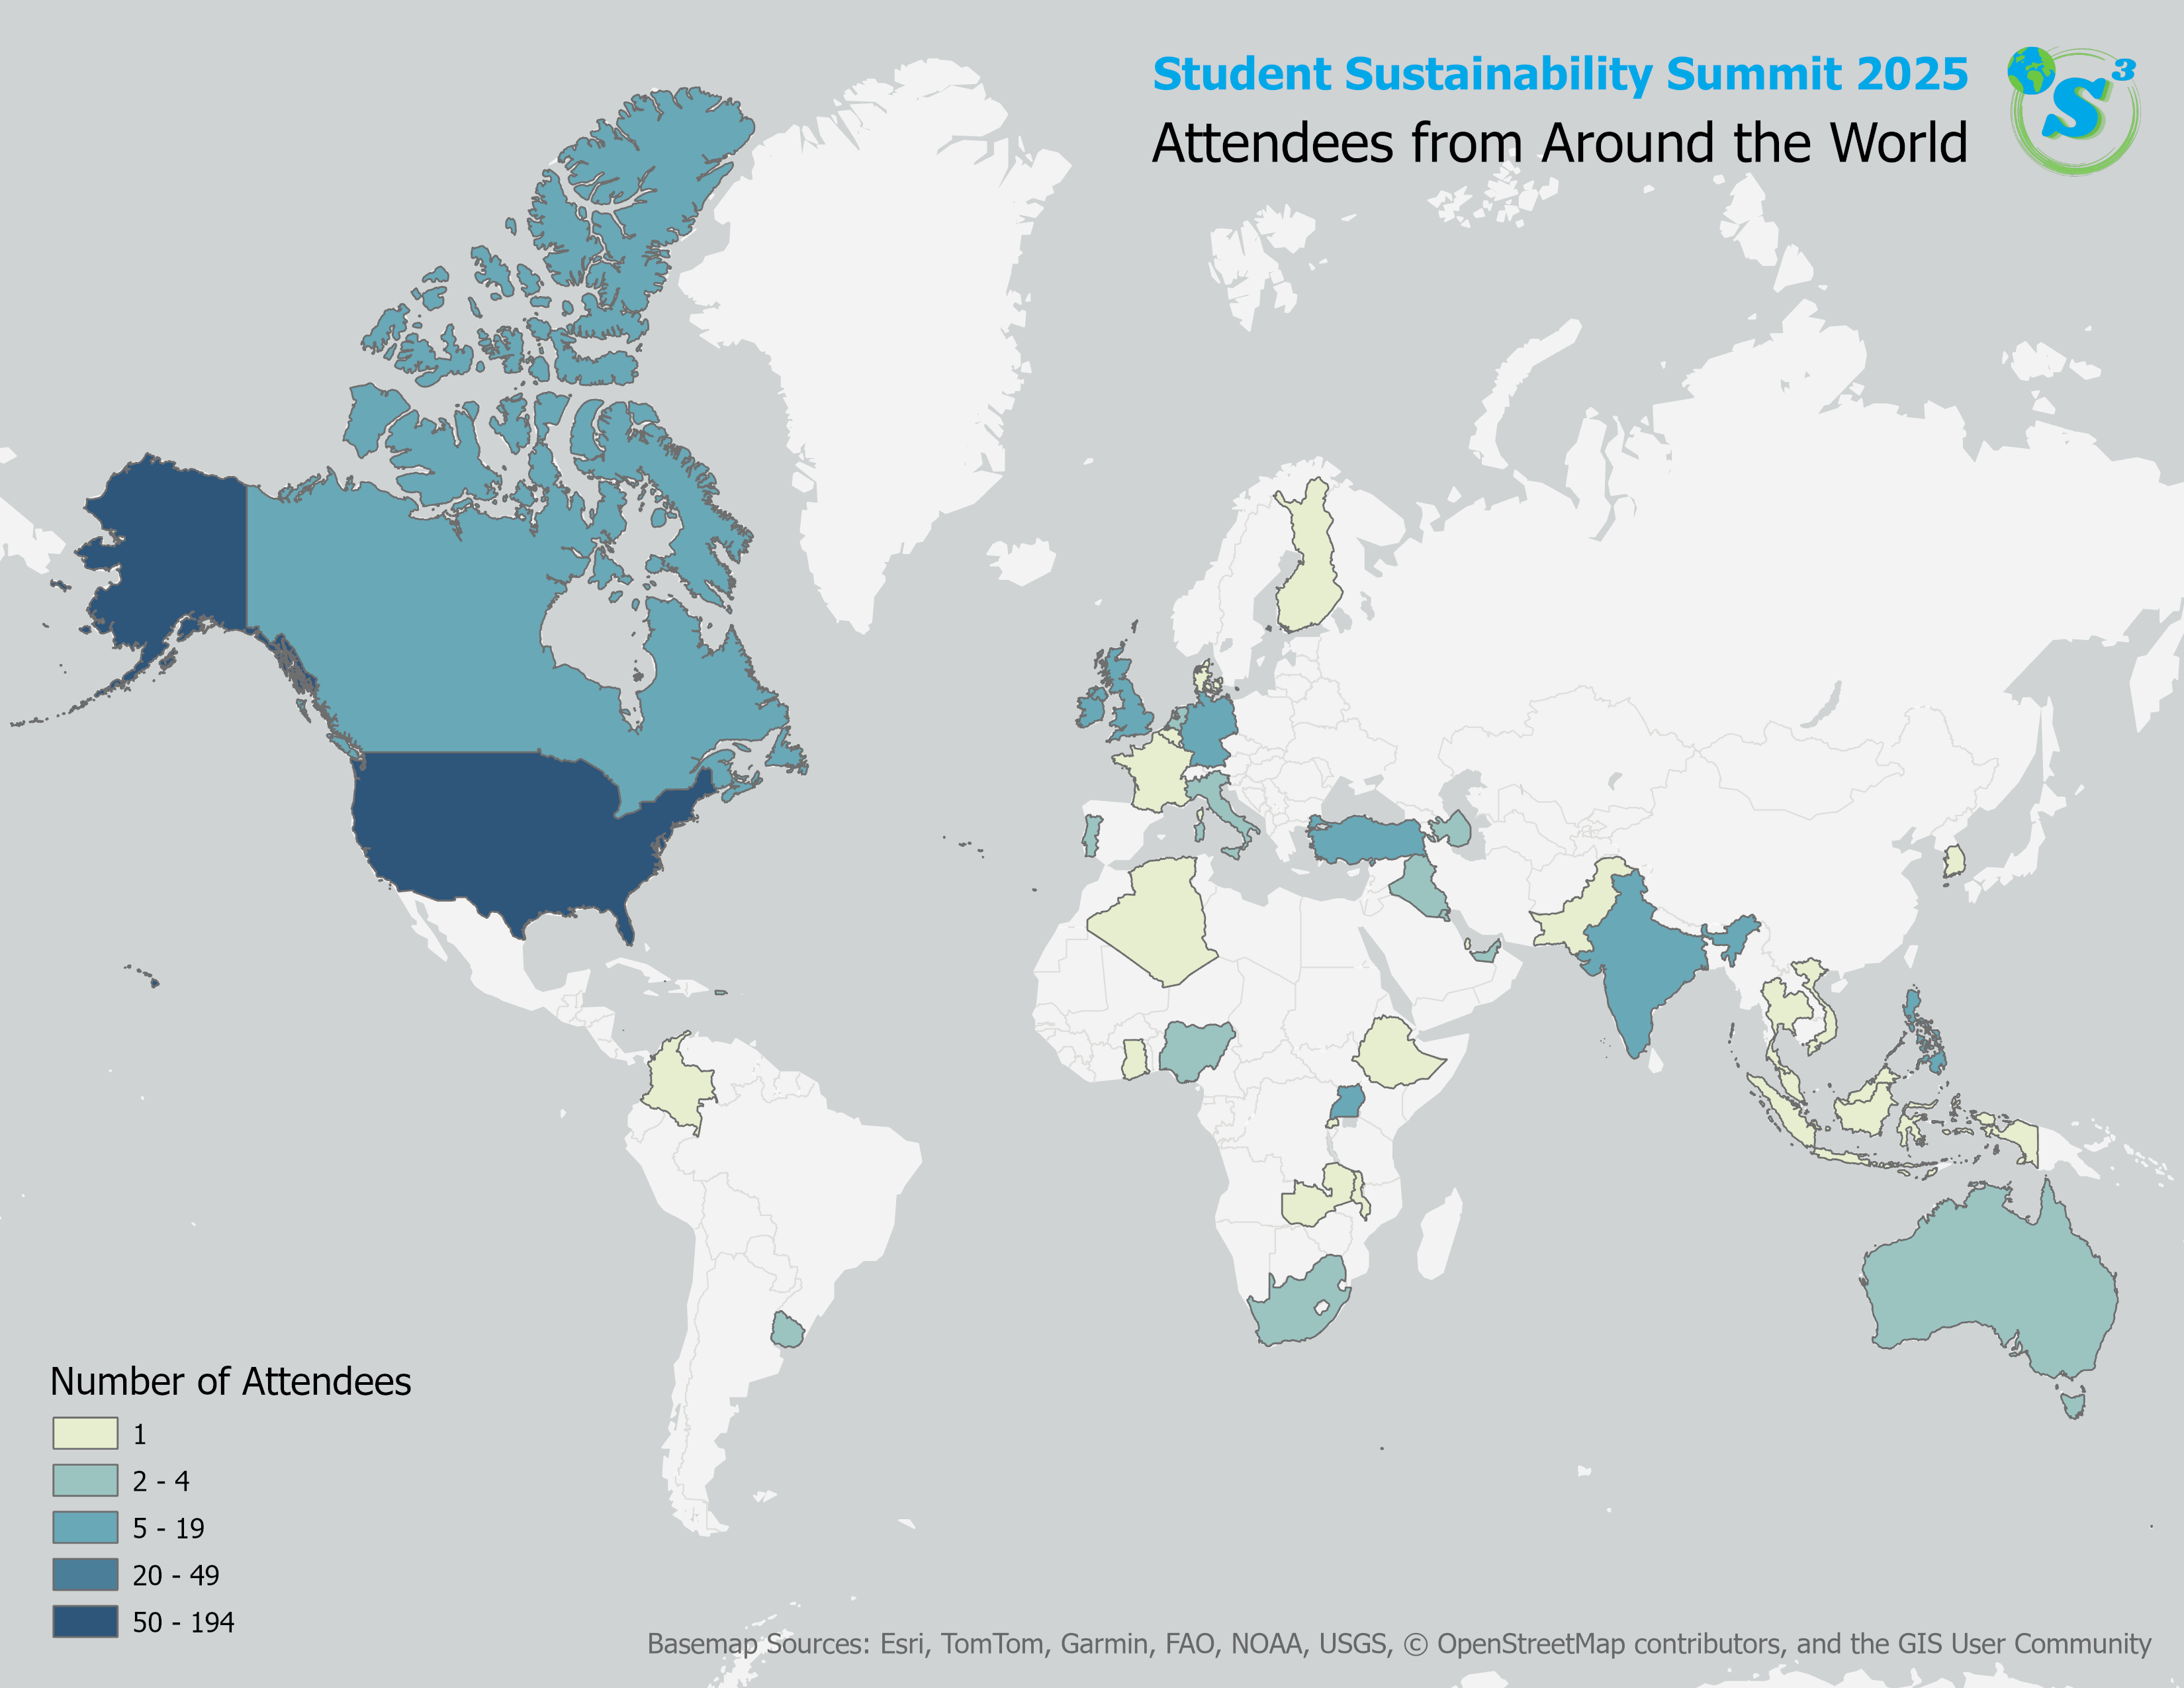
Geospatial Data Workshop at the Student Sustainability Summit
Our team led a workshop introducing how to analyze spatial data about wildfires in California as part of our presentation about the intersection of data science and sustainability.
Data VisualizationPythonEducation
Complete